pandasのグラフ機能はpandasのimportだけで便利なのですが、少々挙動に癖がありますのでメモです。 まずは集計したデータを扱うものたちです。
円グラフ
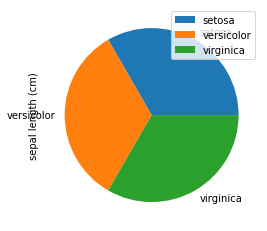
円グラフは列の数値をまとめたものを、行単位で分けた形になります。
#複数列あるうちの一つ
iris.groupby('Species').count().plot.pie(y='sepal length (cm)')

#複数列を同時にまとめる
iris.groupby('Species').count().plot.pie(subplots = True)

#ピボットする際は、円の数が列、円を分ける単位を行にする
#df.pivot_table(index=col,column = col,values=col).reset_index().plot.pie(subplots =True)


棒グラフ
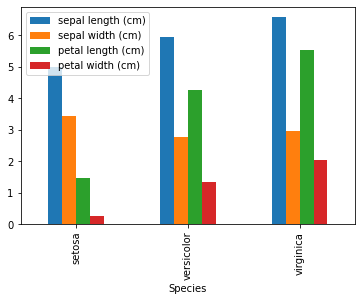
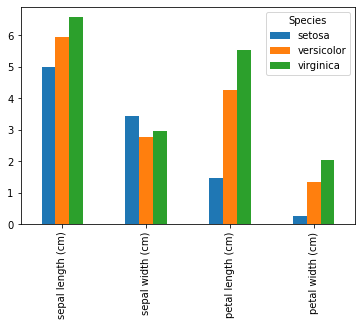
棒グラフでは行が最初の単位、列が二つ目の単位になります。 barではなくbarhにすることで水平方向に変えることができます。
iris.groupby('Species').mean().plot.bar()

iris.groupby('Species').mean().T.plot.bar()

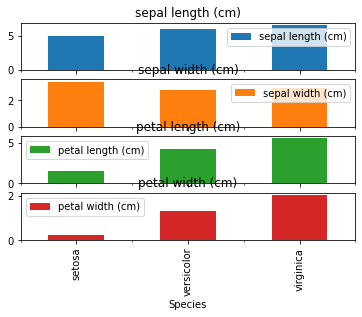
#subplotsで2軸目を横(=グラフ)の分割に変換
iris.groupby('Species').mean().plot.bar(subplots=True)

#積み上げにもできる。クロス集計して構成をみたいときに
#df.pivot_table(...).plot.bar(stacked=True)


